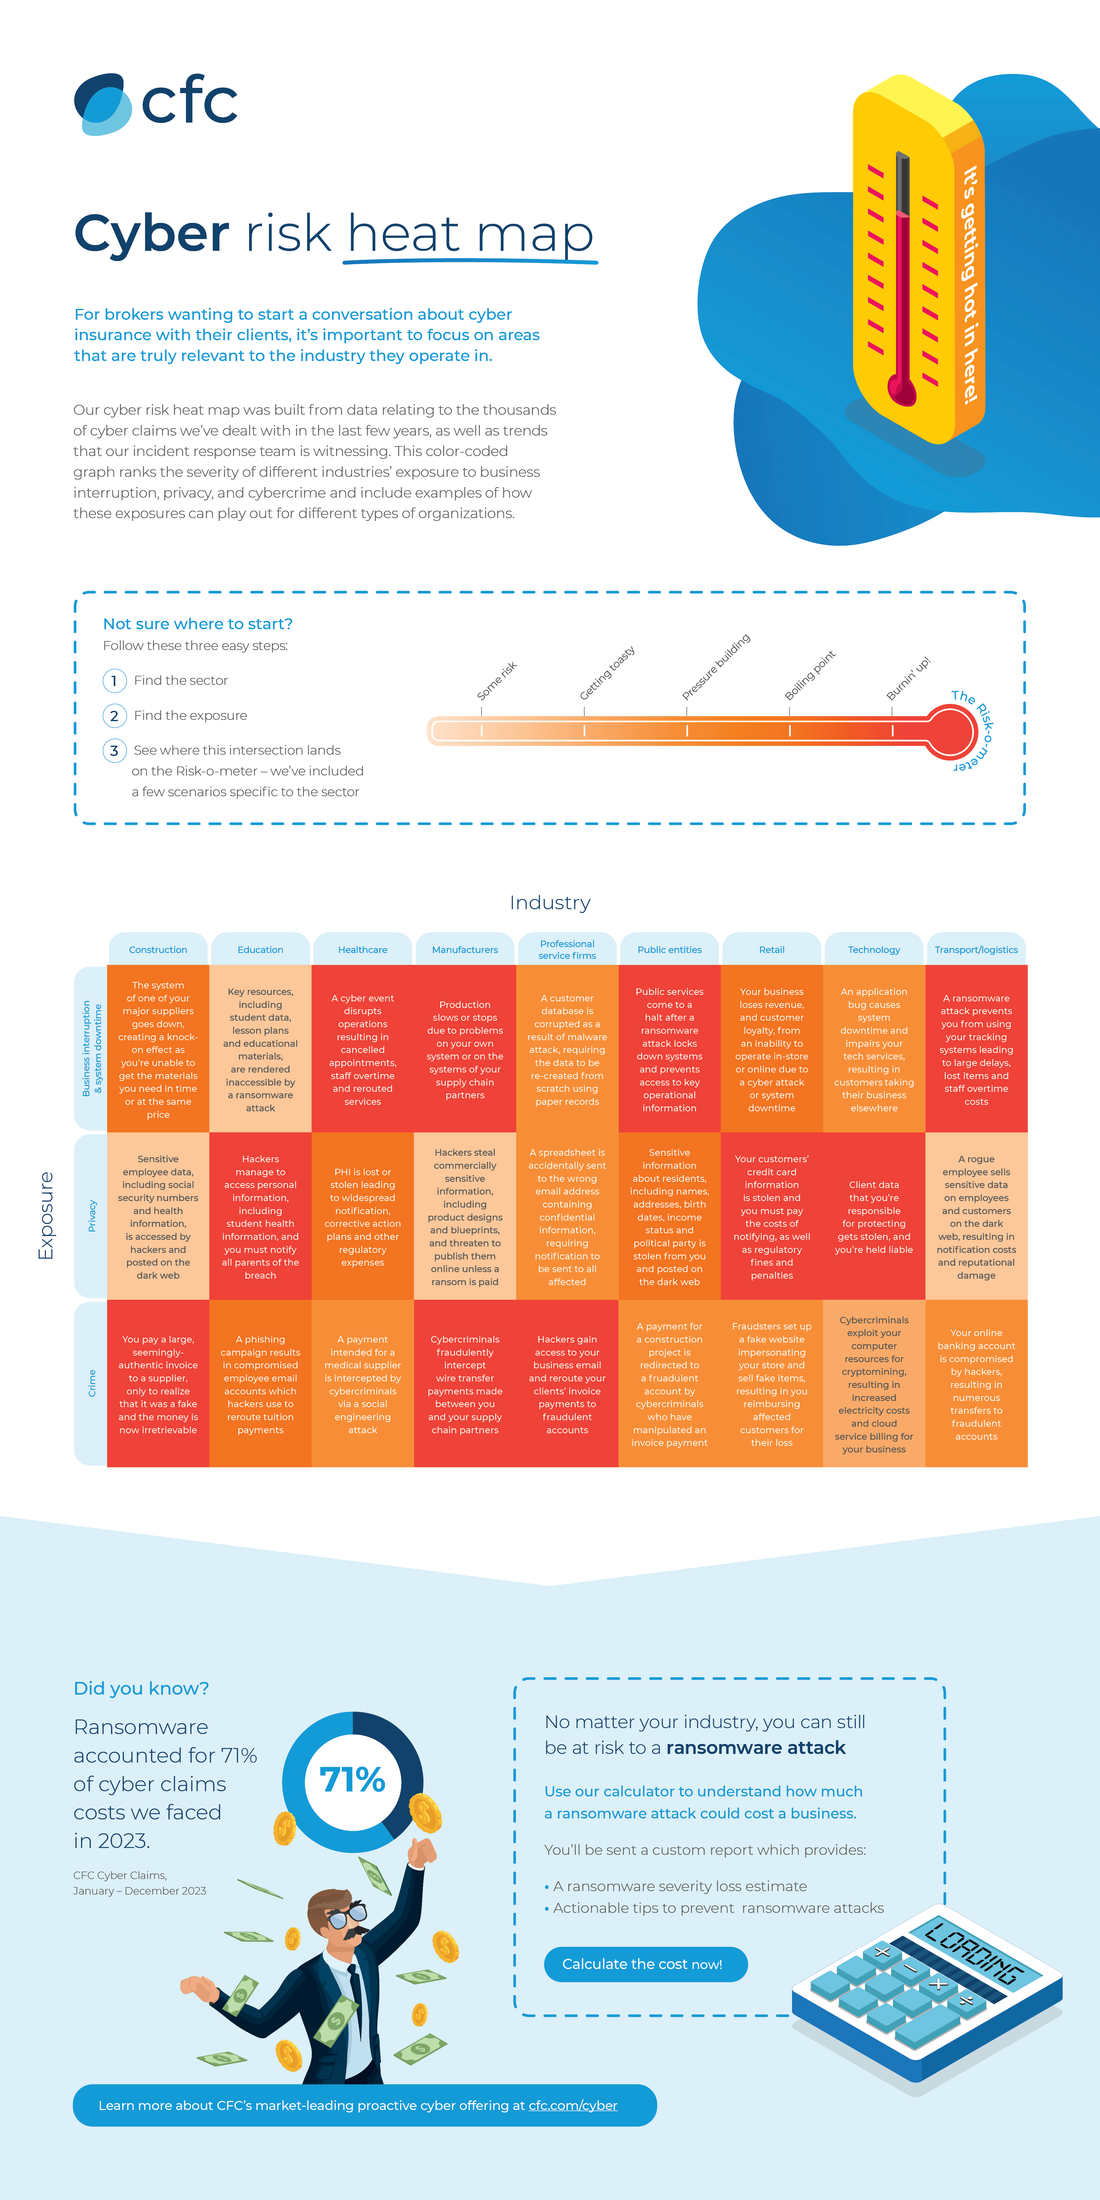
Our cyber risk heat map was built from data relating to the thousands of cyber claims we’ve dealt with in the last few years, as well as trends that our incident response team is witnessing. This color-coded graph ranks the severity of different industries’ exposure to business interruption, privacy, and cybercrime and include examples of how these exposures can play out for different types of organizations.
Updated April, 2024


